📊 Decision Intelligence at the Speed of Thought

    Every team has its own number., One real-time truth, in Arabic and English.

    Executive cockpits and self-service analytics on Power BI, Tableau or Qlik, with one governed metric layer beneath them all.

    The Problem

    Your leaders fly blind between board meetings, and the dashboards they do see don't agree.

    When the executive team can't trust the number on the screen, decisions slow down and risk goes up. Real-time, governed BI is how you get the room aligned again.

    1
    Numbers don't match

    Finance, sales, and operations each pull from different extracts. Every leadership meeting starts with a 20-minute argument about whose number is right.

    2
    Insights arrive too late

    By the time the monthly pack lands, the quarter is already lost. Leaders are reacting to history instead of steering the business.

    3
    BI is stuck on the BI team

    Every question becomes a ticket. Frontline managers can't self-serve, so they make decisions on gut feel instead of data.

    Market signal

    What actually changed

    Specific observations from Saudi and GCC engagements and tenders, not generic predictions.

    Consolidation

    Power BI's lead widened because of licensing, not features

    Bundling with Microsoft 365 and Fabric puts it inside budgets that were already approved. Qlik holds a loyal but shrinking base in Saudi telco and government, and Tableau has become a distant third in new logos here.

    Semantic layer

    Metric inconsistency turned semantic layers from theory into a line item

    Parallel reporting across Power BI, Excel and legacy analytics produced the familiar board-meeting argument about which revenue number is right. Buyers now ask for a semantic layer by name, a question almost nobody was asking three years ago.

    Copilots

    Heavily demoed, thinly used in production

    Natural-language query features close deals but see limited trusted use on regulated numbers. The pattern across the region is enthusiastic pilot, quiet retreat to human-verified reporting, and no fallback plan designed into the rollout.

    Embedded

    Embedded analytics is now a mainstream ask, and row-level security is where it overruns

    Putting dashboards inside a customer-facing product is production-viable, but multi-tenant security design is consistently underestimated as a licensing conversation when it is an architecture one.

    Our Solutions

    What We Deploy

    Enterprise-grade capabilities, deployed in Saudi Arabia and worldwide

    Real-Time Executive Dashboards

    Live KPIs that refresh in seconds, not days. Revenue, operations, customer health, all in one pane of glass.

    Ask Your Data in Arabic

    Natural language queries in Arabic and English. Ask 'ما هي مبيعات الربع الثالث؟' and get instant charts.

    Embedded Analytics

    Embed interactive charts and dashboards directly into your apps, portals, and workflows. White-labeled.

    Automated Anomaly Detection

    AI that monitors your KPIs 24/7 and alerts you when something deviates. No more surprise revenue dips.

    Predictive Forecasting

    ML-powered forecasts for revenue, demand, churn, and inventory. See the future, not just the past.

    Self-Service BI Platform

    Enable every department to build their own reports. Governed data catalog, drag-drop builder, no SQL needed.

    Platform Showcase

    A Glimpse of Our Work

    Dashboards and interfaces we've built for enterprise clients worldwide

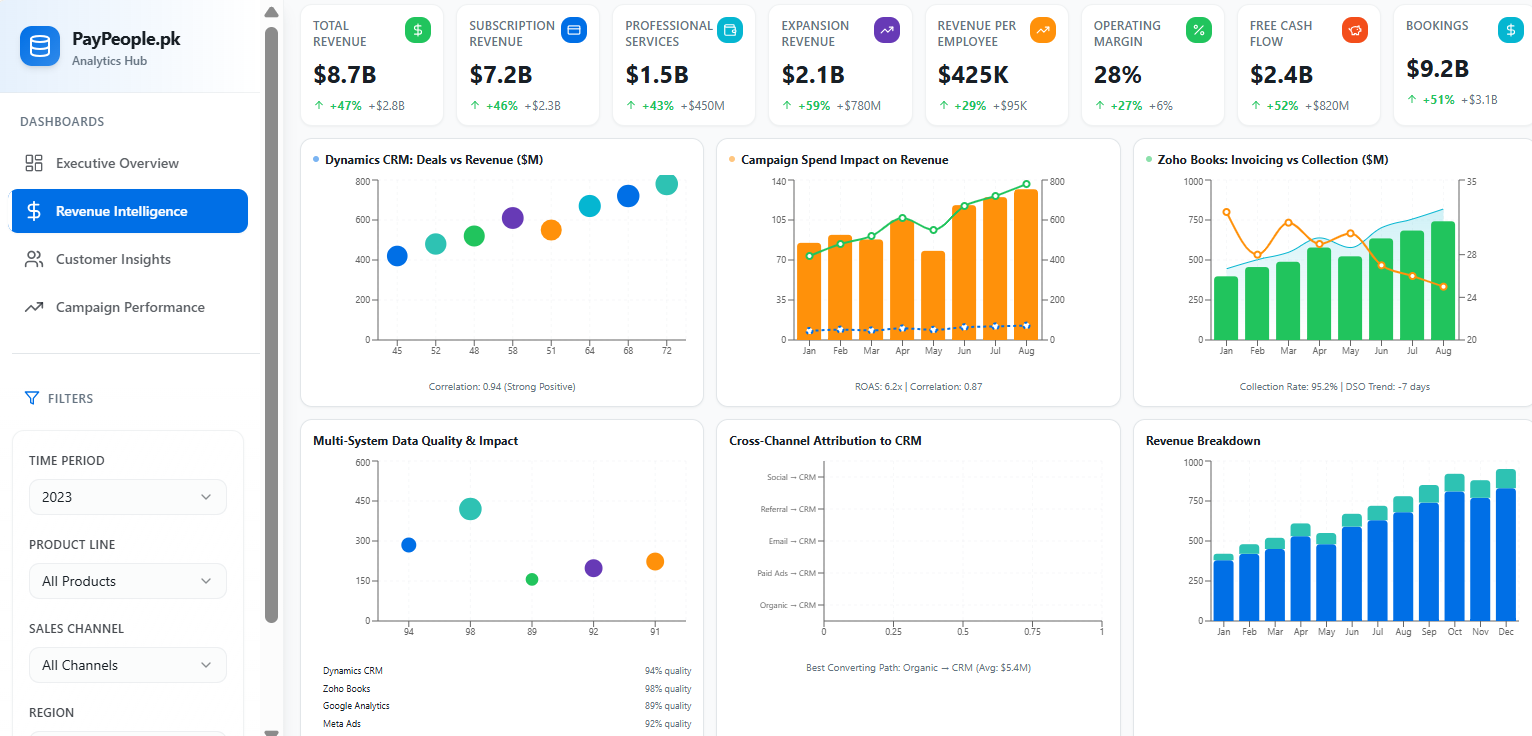
    Revenue Intelligence: Multi-Source Analytics

    Revenue Intelligence: Multi-Source Analytics

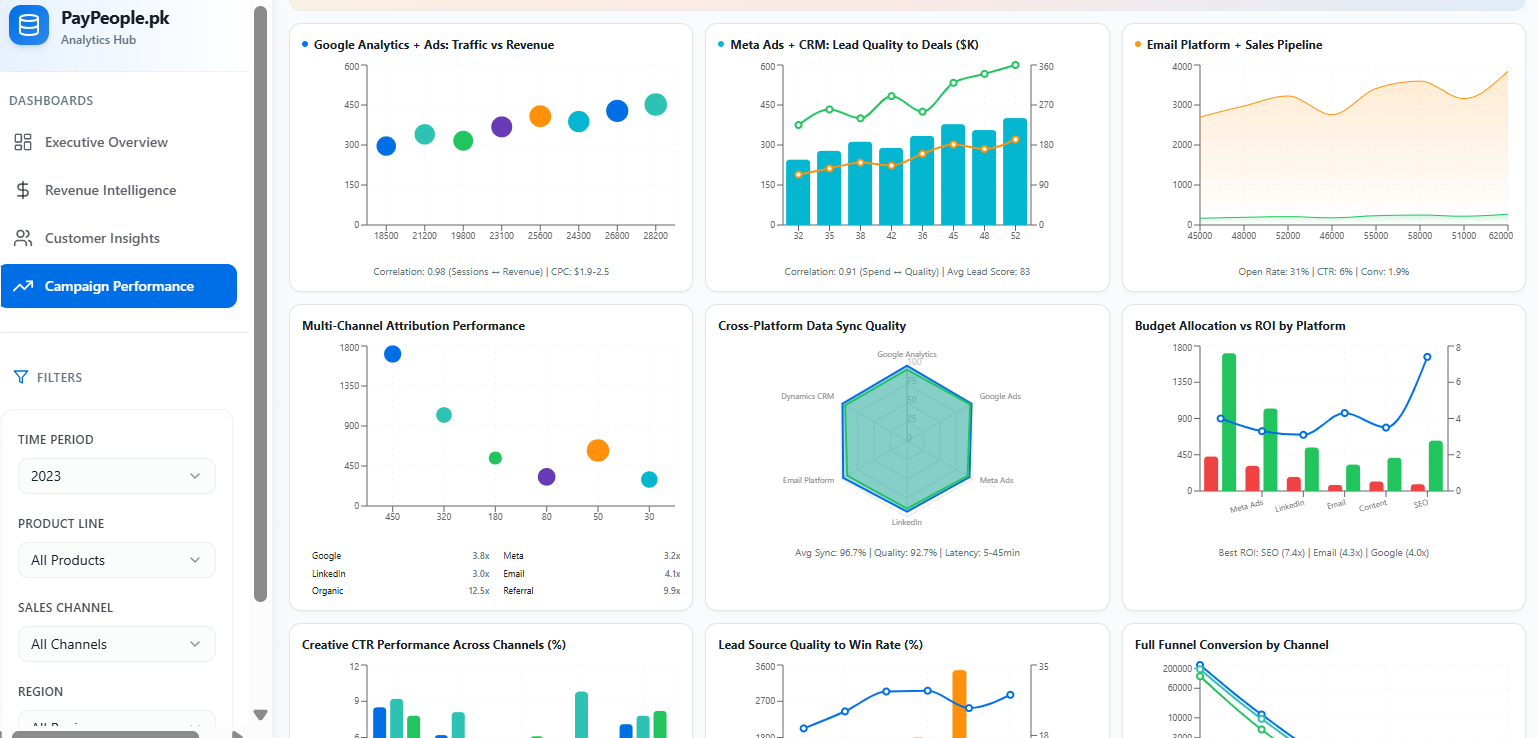
    Campaign Performance: Cross-Channel Attribution

    Campaign Performance: Cross-Channel Attribution

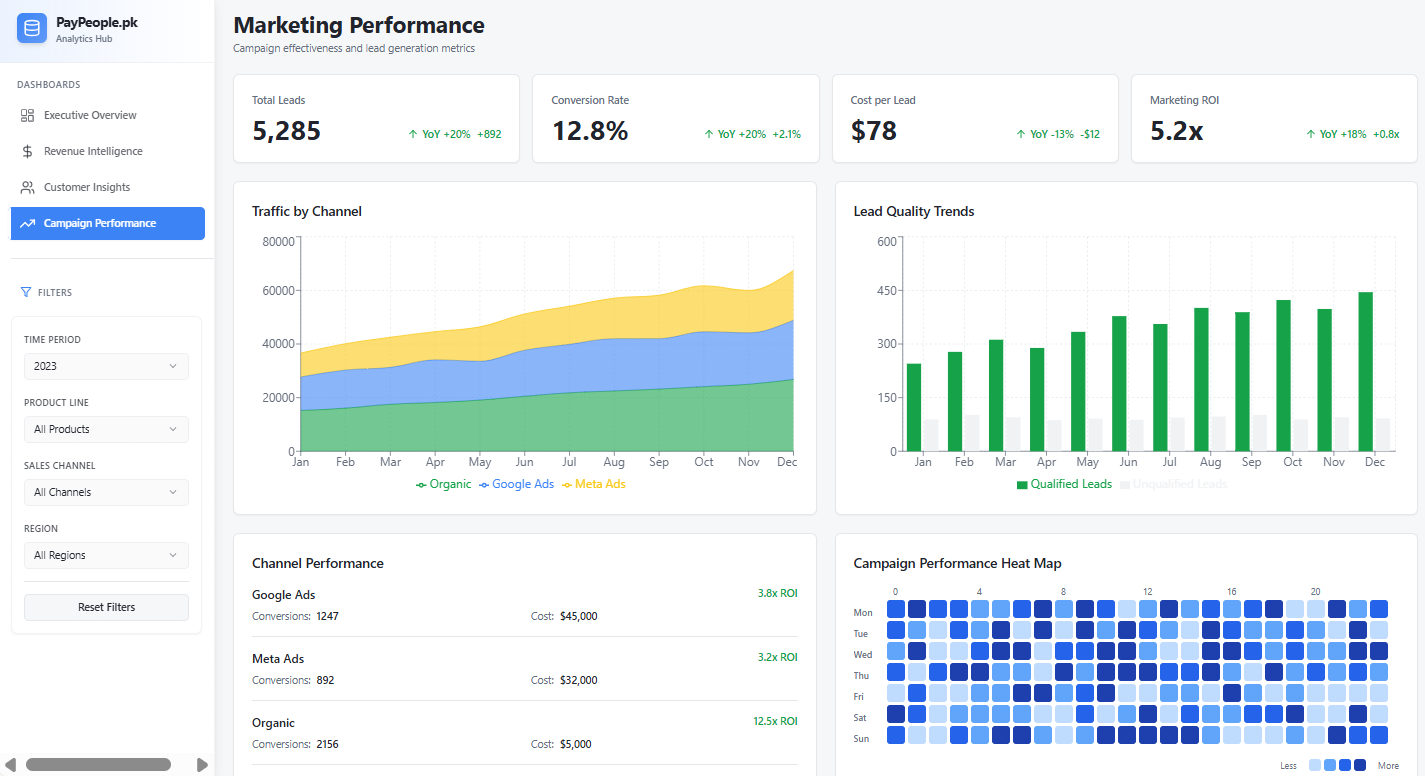
    Marketing Performance: Lead Generation Metrics

    Marketing Performance: Lead Generation Metrics

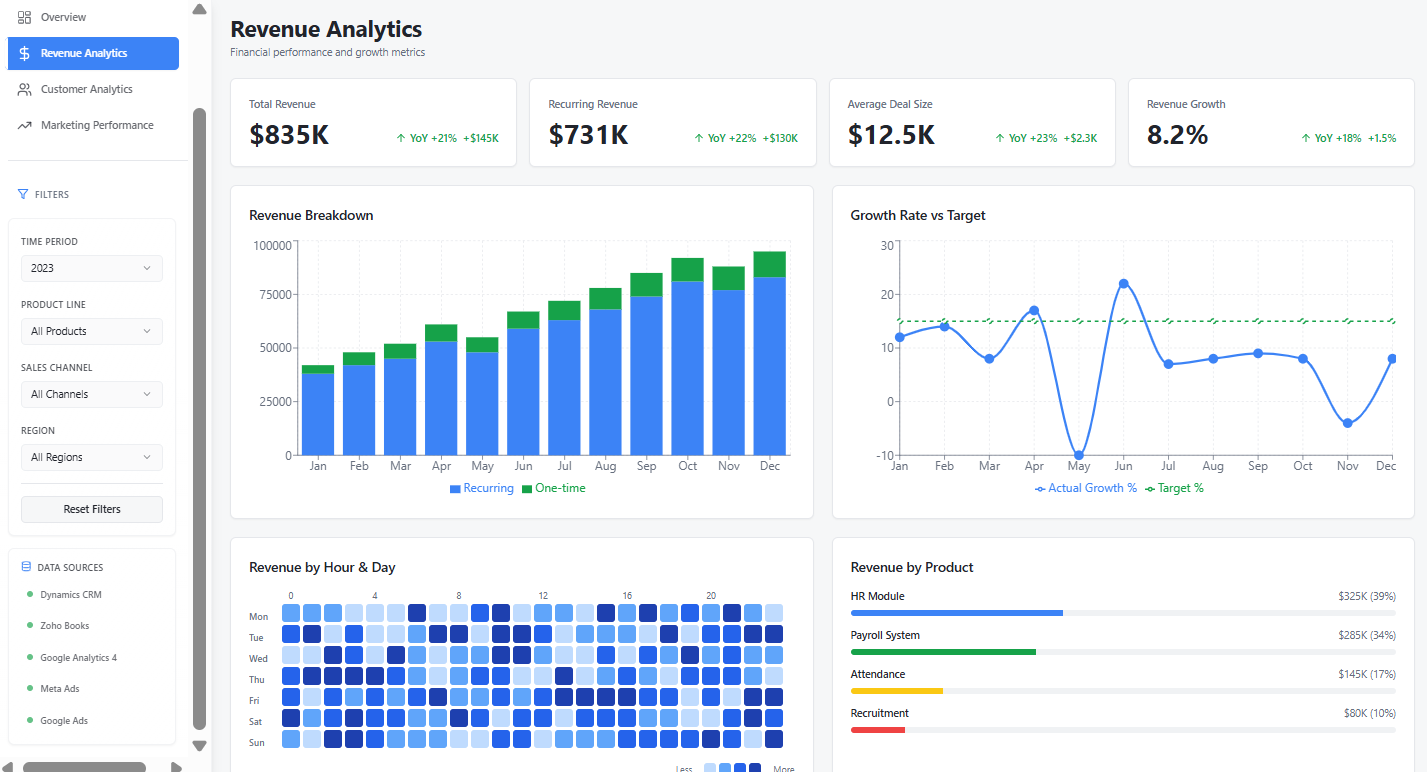
    Revenue Analytics: Financial Performance Dashboard

    Revenue Analytics: Financial Performance Dashboard

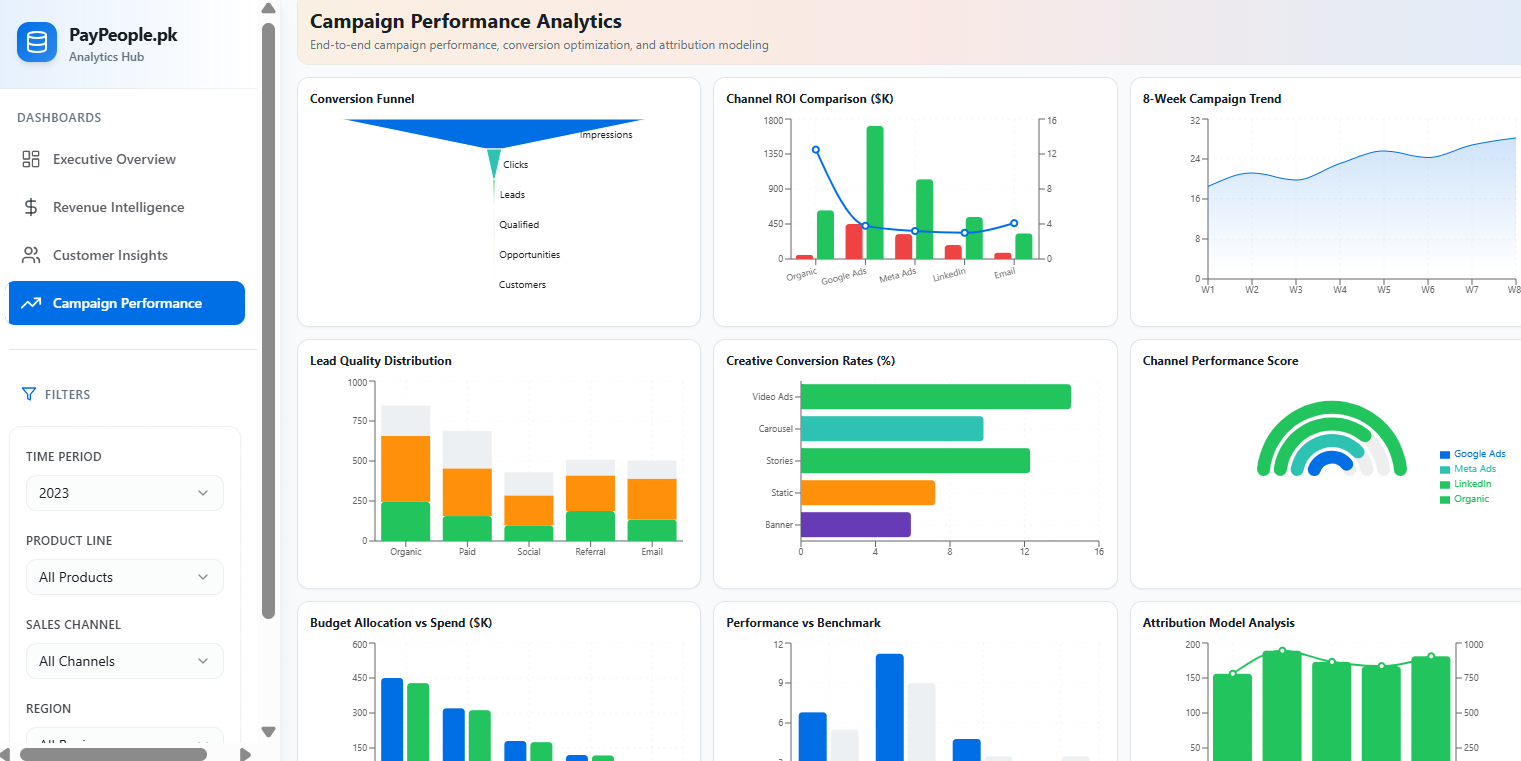
    Campaign Analytics: Conversion Funnel & ROI

    Campaign Analytics: Conversion Funnel & ROI

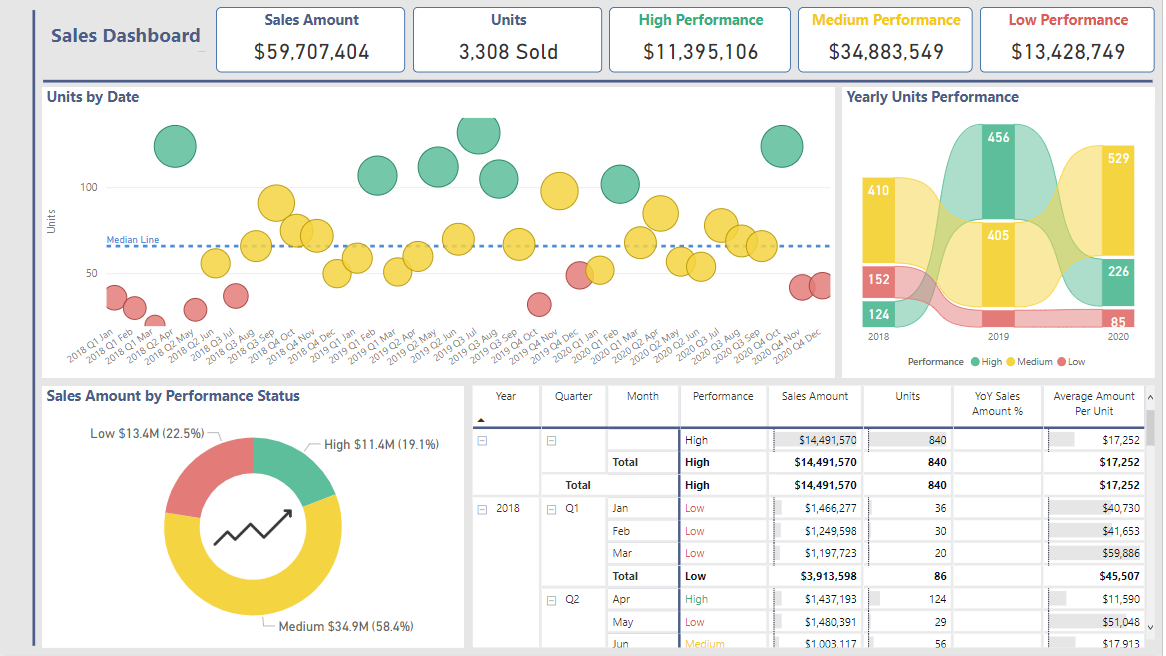
    Sales Dashboard: Performance & KPIs

    Sales Dashboard: Performance & KPIs

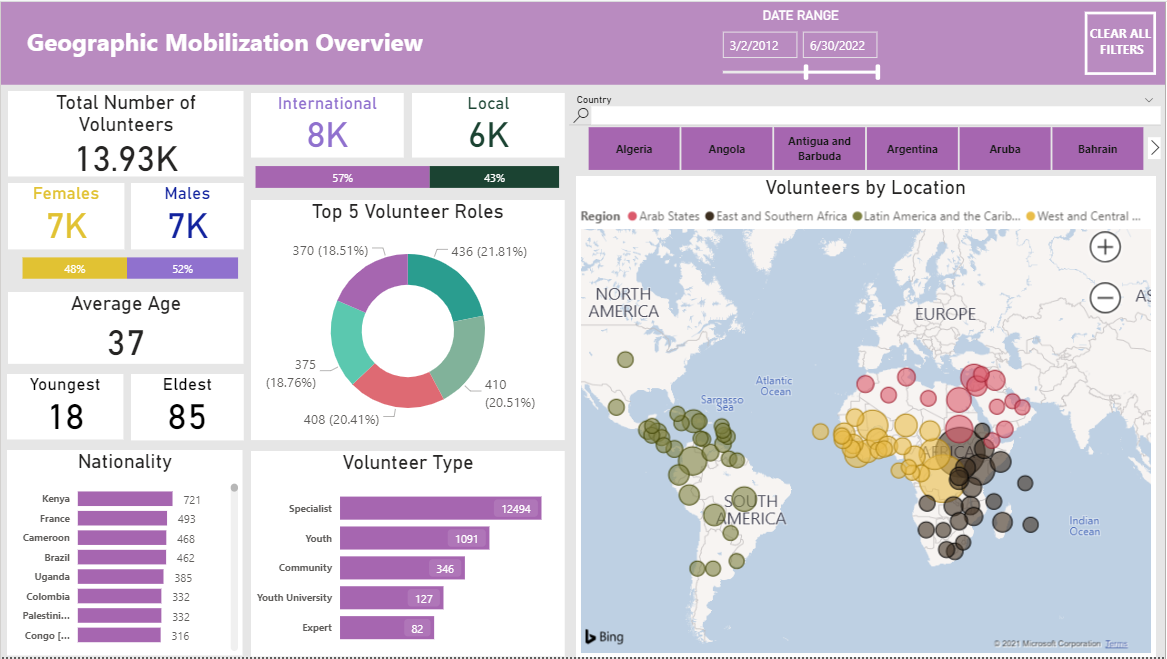
    Geographic Mobilization: Power BI Dashboard

    Geographic Mobilization: Power BI Dashboard

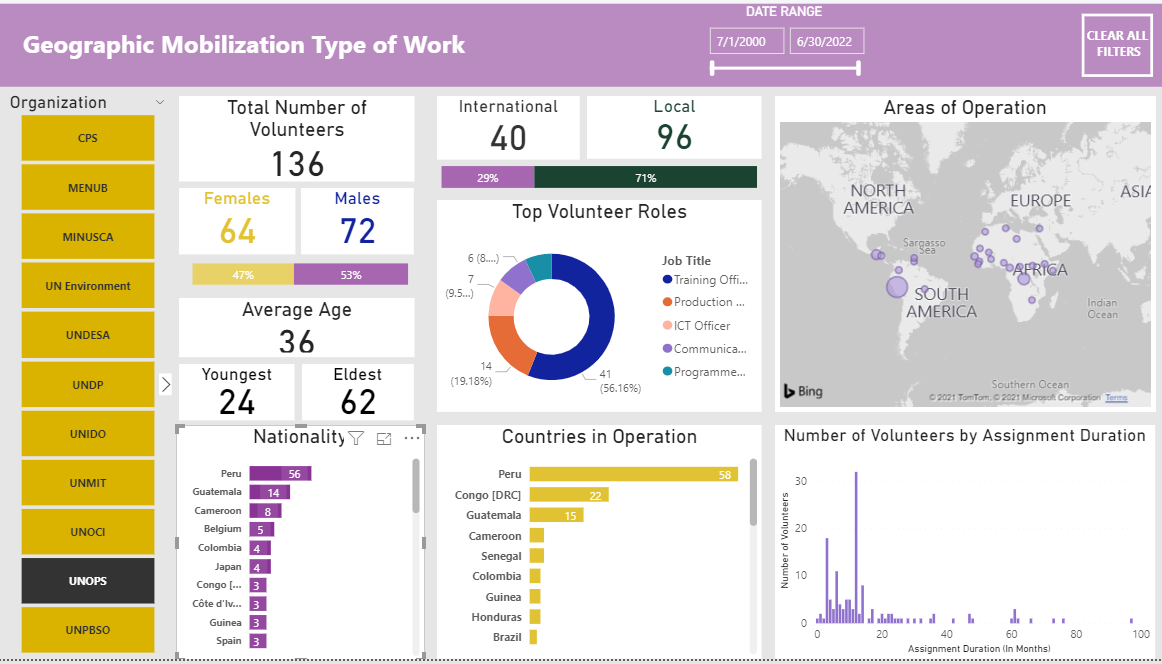
    Workforce Analytics: Type of Work Breakdown

    Workforce Analytics: Type of Work Breakdown

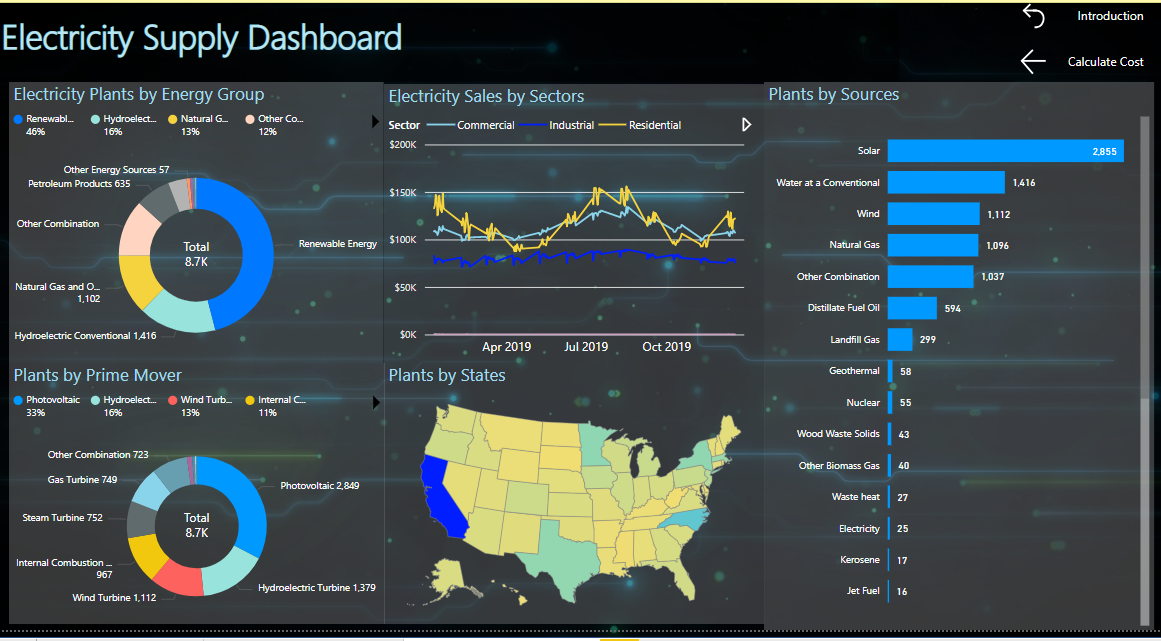
    Electricity Supply: Energy Sector Analytics

    Electricity Supply: Energy Sector Analytics

    9 dashboards built for enterprise clients

    Click any dashboard to view full-screen

    Process

    How We Deliver

    From assessment to measurable ROI in weeks, not months

    01

    Requirements Sprint

    Identify key decision-makers, critical KPIs, data sources, and existing tool landscape

    02

    Data Modeling

    Build semantic layer, star schemas, and governed metric definitions everyone agrees on

    03

    Dashboard Development

    Design and build interactive dashboards with real-time data connections and mobile access

    04

    Training & Adoption

    Hands-on training, champions program, and continuous optimization based on usage analytics

    Use Cases

    Deployed Across Industries

    Proven results in every major sector

    Banking

    Real-time branch performance, loan portfolio dashboards, and regulatory compliance reports

    Retail

    Store-level P&L, inventory optimization dashboards, and customer lifetime value analytics

    Government

    National KPI dashboards tracking Vision 2030 progress across ministries

    Manufacturing

    OEE dashboards, production line monitoring, and supply chain visibility

    Healthcare

    Hospital operations dashboards, patient flow analytics, and clinical outcome tracking

    Education

    Student performance analytics, enrollment forecasting, and faculty workload dashboards

    Technologies & Platforms

    The platforms we build on

    Every platform here is a 2026 Gartner Magic Quadrant Leader or category standard, so your stack stays current, defensible, and future-proof.

    BI & Visualization

    Microsoft Power BIMicrosoft Power BI
    TableauTableau
    Qlik SenseQlik Sense
    LookerLooker

    Augmented & Embedded

    ThoughtSpotThoughtSpot
    SisenseSisense
    Power BI EmbeddedPower BI Embedded
    Tableau PulseTableau Pulse

    Enterprise BI

    SAP Analytics CloudSAP Analytics Cloud
    Oracle AnalyticsOracle Analytics
    IBM CognosIBM Cognos
    MicroStrategyMicroStrategy

    Semantic & Metric Layer

    dbt Metricsdbt Metrics
    Cube.devCube.dev
    Databricks UnityDatabricks Unity
    Looker ModelerLooker Modeler

    Data Sources

    SnowflakeSnowflake
    DatabricksDatabricks
    Microsoft FabricMicrosoft Fabric
    Google BigQueryGoogle BigQuery

    Open Source

    Apache SupersetApache Superset
    MetabaseMetabase
    GrafanaGrafana
    RedashRedash
    How the work is structured

    How decision reporting is structured

    1

    Definitions

    • Agreed metric owners
    • One definition per measure
    • Published change history
    2

    Semantic layer

    • Governed calculations
    • Row-level security
    • Reusable across tools
    3

    Delivery

    • Executive and operational views
    • Arabic and English side by side
    • Mobile-first reading
    4

    Adoption

    • Usage monitoring
    • Retirement of dead reports
    • Feedback into definitions
    What people actually use decides what gets kept, extended or retired.
    Selected work

    Work we have delivered

    Client identities are withheld. The situations, the build and the change afterwards are as they happened.

    Executive reporting

    A Saudi retail group

    The situation
    Competing revenue definitions across finance and commercial teams turned every review into a debate about the numbers.
    What we built
    A governed semantic layer with named metric owners and a published definition history.
    What changed
    Reviews start from an agreed number and move to the decision.

    Plant performance

    An industrial manufacturer

    The situation
    Plant managers maintained private spreadsheets because the central reports did not match what they saw on the floor.
    What we built
    Operational views modelled with the plants themselves, drilling from the summary to the shift record.
    What changed
    The private spreadsheets stopped being maintained because the central view finally answered the question.

    Bilingual reporting

    A financial services provider

    The situation
    Arabic reporting existed as a translated afterthought and leadership defaulted to the English version.
    What we built
    Bilingual reports designed together with correct right-to-left layout, numerals and terminology.
    What changed
    Arabic reporting is used in its own right rather than treated as a compliance copy.

    Where we are strongest

    We make reporting an agreement, not another set of screens.

    One definition, enforced in the layer

    Metrics are governed centrally so the same measure returns the same answer in every tool that reads it.

    Arabic reporting designed, not translated

    Right-to-left composition, numeral conventions and financial terminology are part of the design, which is why the Arabic view gets used.

    Built for the decision in the room

    Each view is designed around a recurring decision and its owner, so nothing ships without someone who needs it weekly.

    Adoption tracked and acted on

    Usage is monitored and unused reports are retired, which keeps the estate small enough to trust.

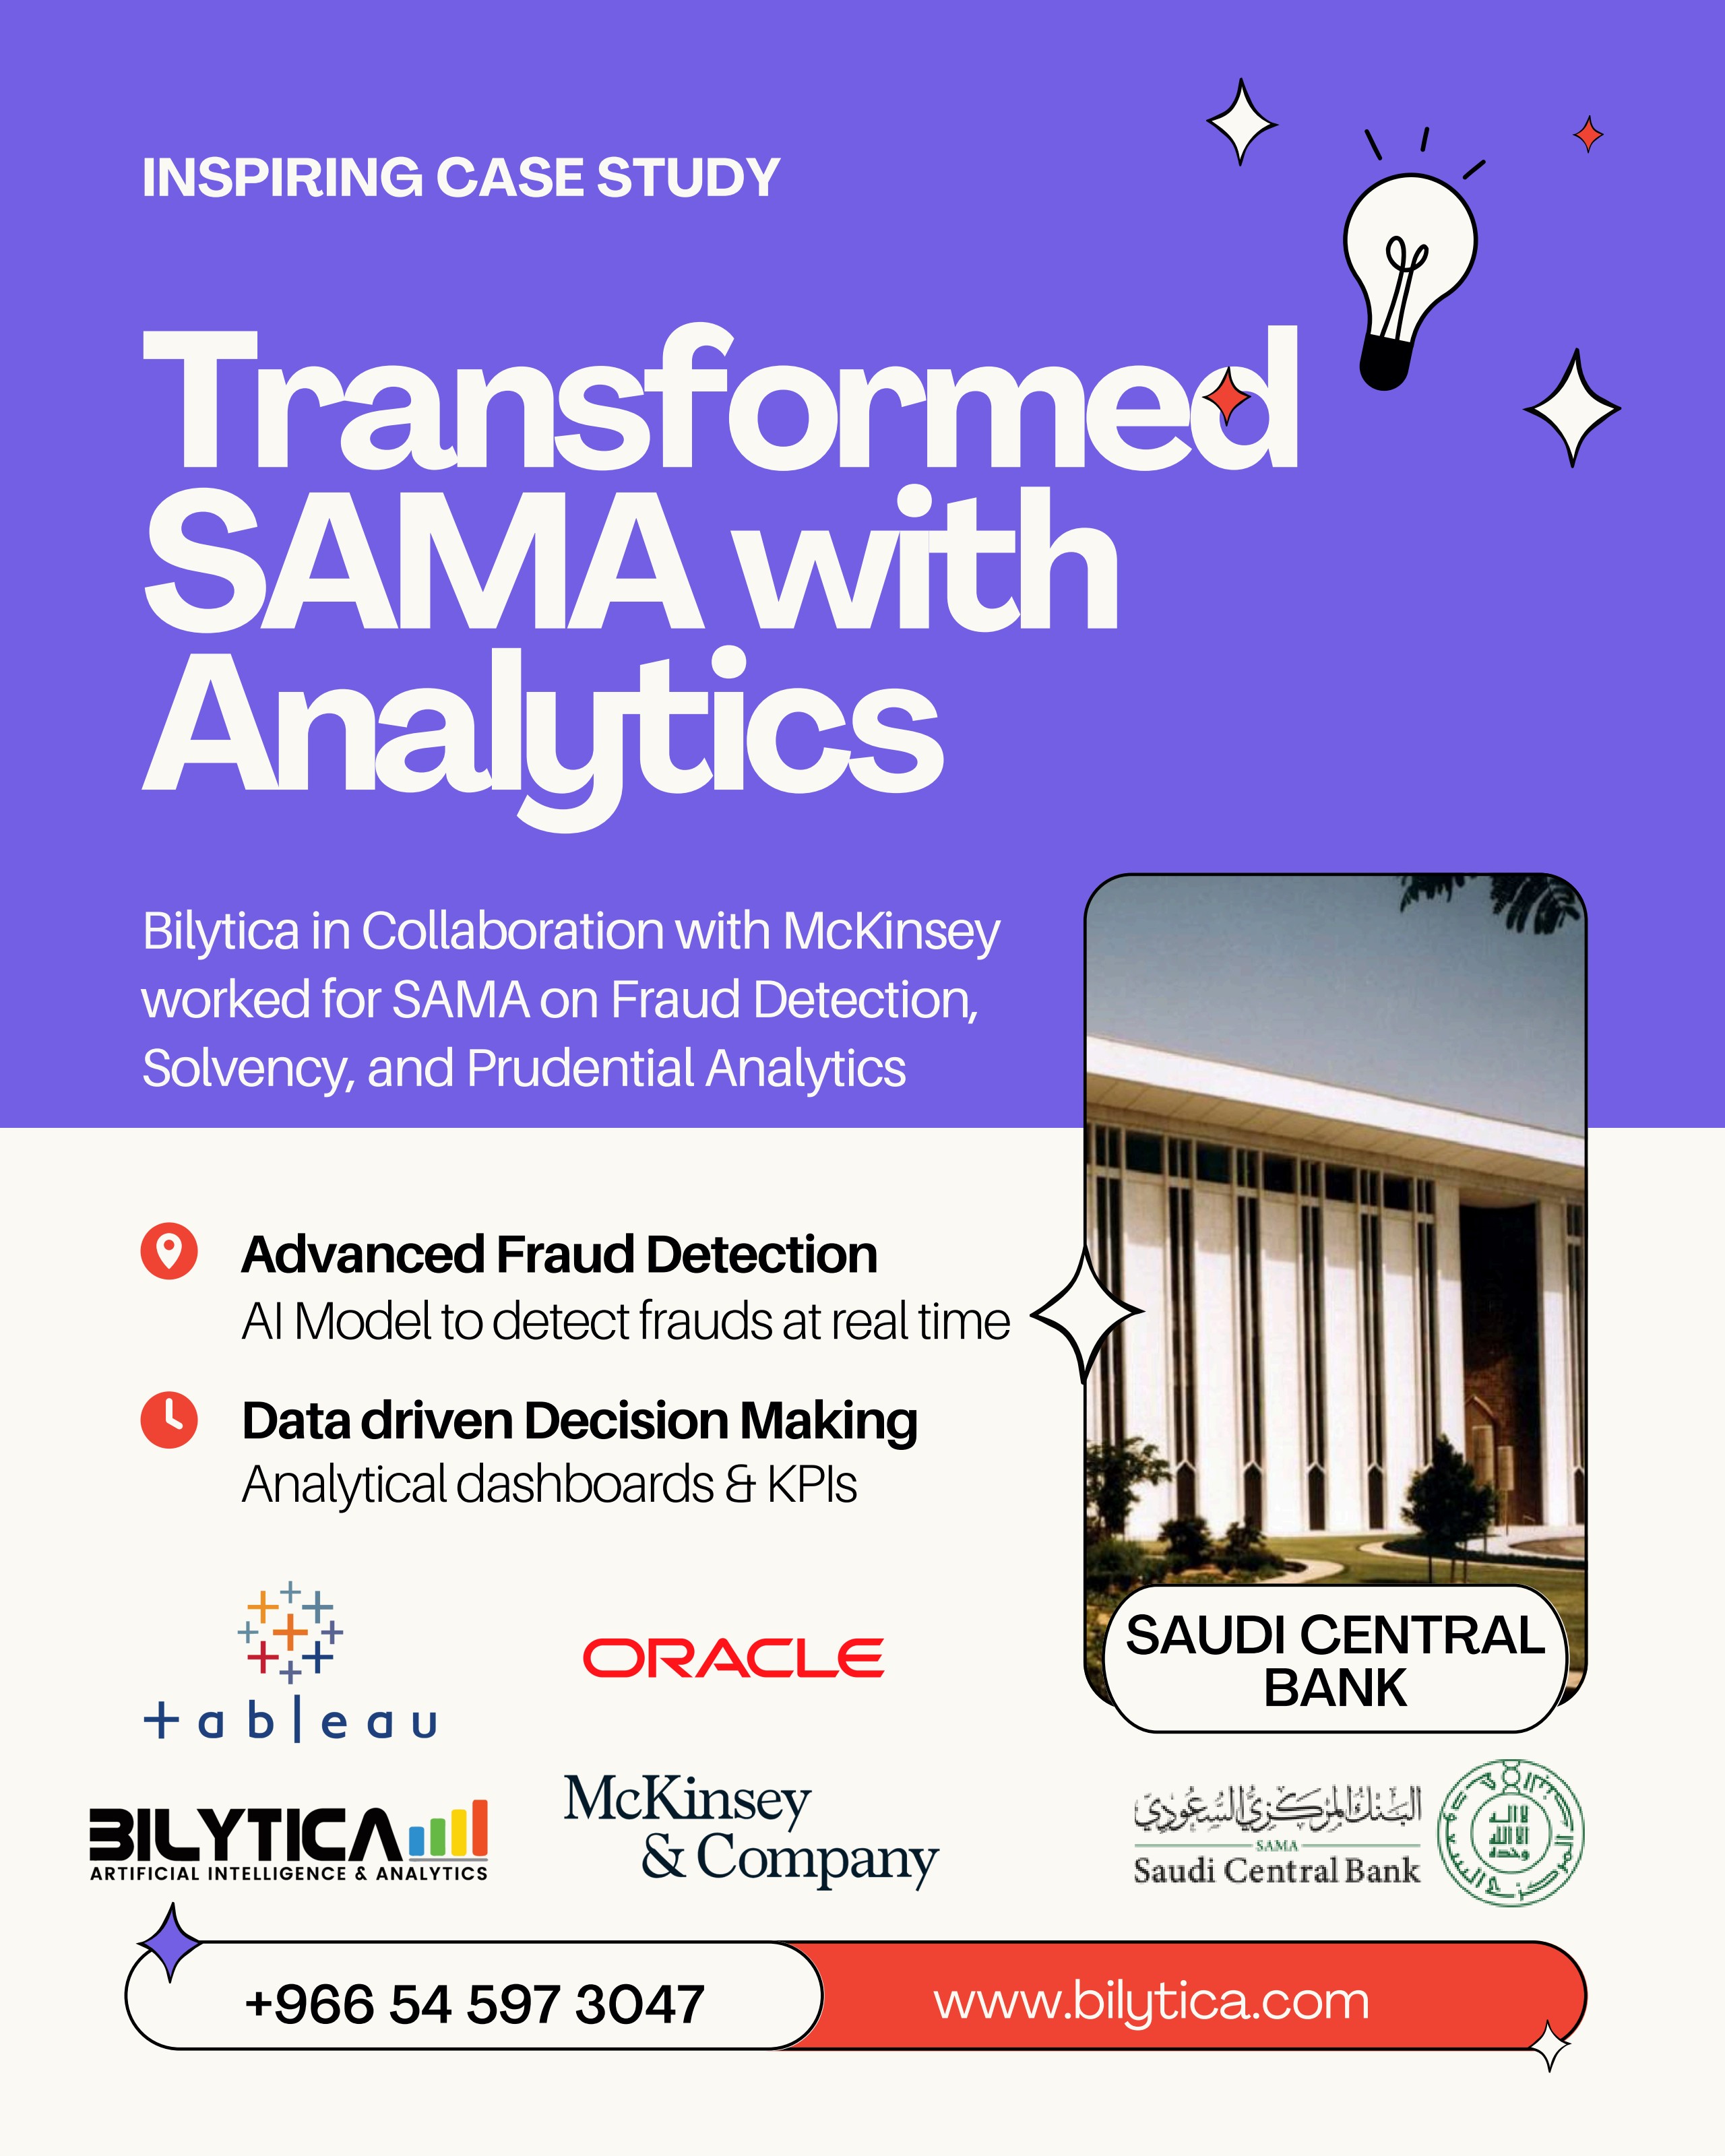
    Inspiring Case Study

    Transformed SAMA with Analytics

    Bilytica in collaboration with McKinsey worked for SAMA on Fraud Detection, Solvency, and Prudential Analytics.

    • Advanced Fraud Detection
      AI model to detect frauds in real time
    • Data-driven Decision Making
      Analytical dashboards & KPIs
    TableauTableau
    OracleOracle
    Featured Success Story
    “Bilytica delivered an enterprise-wide analytics transformation, deploying real-time AI fraud detection models, solvency monitoring dashboards, and prudential analytics using Tableau and Oracle. Data-driven decision making is now at the core of central bank operations.”
    Saudi Central Bank: SAMA
    Banking & Financial Regulation
    Real-time Fraud Detection & Prudential Analytics
    SDAIA AlignedVision 2030PDPL · NDMONCA ECCSAMA Ready

    Built for Vision 2030, AI the Kingdom's regulators recognize.

    Every Bilytica AI solution is engineered for the Saudi governance stack: SDAIA Generative AI controls, PDPL data-subject rights supervised by the NDMO, NCA ECC cybersecurity, and sector frameworks from SAMA, CST, MoH and Etimad. Workloads stay inside Saudi data borders on STC Cloud, Mobily, Oracle KSA or Microsoft Saudi regions, with evidence packs ready for audit on demand.

    SDAIA AI Society partner
    Aligned with the National Strategy for Data & AI led by SDAIA, Generative AI guidelines applied to every deployment.
    Vision 2030
    Built around Vision 2030 priorities: digital government, sovereign cloud, Saudization of AI talent and an in-Kingdom data economy.
    PDPL · NDMO
    Personal Data Protection Law controls supervised by the NDMO, data-subject rights, lineage and DPIAs ready out of the box.
    NCA ECC + SAMA
    Essential Cybersecurity Controls from the NCA plus SAMA cyber + outsourcing frameworks, evidence packs generated continuously.
    From live tenders

    What buyers are asking us

    The questions that come up in almost every vendor evaluation, answered straight.

    “Should we consolidate everything onto Power BI?”

    For most Saudi enterprises, yes, licensing economics and local talent availability make it the rational default. The genuine exceptions are heavy embedded or OEM analytics requirements and complex associative exploration, where Qlik still has a real technical edge.

    “Can we trust the BI copilot for board reporting?”

    Not unsupervised. Natural-language to query generation still produces confidently wrong aggregations often enough that anything board-facing needs a verified semantic model underneath. Treat it as a drafting aid, and say so in the rollout communication.

    “Why does every department report a different number for the same KPI?”

    Because you have twenty datasets each redefining the metric slightly differently. This is a governance failure, not a tooling one, and buying more licences will make it worse. One certified definition per metric, owned by a named person, fixes it.

    “Is self-service analytics worth pushing further?”

    Only with data literacy and access control in place. Without them, self-service produces dataset sprawl and a slow collapse of trust in the platform, the pattern usually becomes visible twelve to eighteen months in.

    “What is actually different about decision intelligence versus plain BI?”

    In most pitches, nothing, dashboards plus an alerting layer, rebranded. Ask the vendor to walk through a specific decision workflow, including who acts and within what window, before paying a premium for the label.

    “Do we still need Tableau or Qlik skills on the team?”

    Only to maintain what you already run. For new hiring and new builds in this market, Power BI and semantic modelling skills are the safer long-term bet.

    FAQ

    Frequently Asked Questions

    Common questions about Every team has its own number., One real-time truth, in Arabic and English..

    Power BI vs. Tableau vs. Qlik, which one do you recommend?

    All three are 2026 Gartner Magic Quadrant Leaders and we deploy all three. The right choice depends on your existing Microsoft, Salesforce or SAP estate, your licensing economics, and where your analyst skills sit. Our consultants run a 1-week scorecard so you choose with eyes open, not based on a sales pitch.

    Can executives ask questions in Arabic?

    Yes. We deploy natural-language querying in Arabic and English on Power BI Copilot, Tableau Pulse, ThoughtSpot, and Databricks Genie. Leaders type or speak 'ما هي مبيعات الربع الثالث؟' and get instant charts، backed by your governed semantic layer so the answer is always defensible.

    How do you make sure every dashboard tells the same story?

    We build a governed semantic layer (dbt Metrics, Cube.dev, or the BI tool's native model) so revenue, churn, OEE and every other KPI has one canonical definition. Every dashboard, every export, every Copilot answer pulls from the same metric, no more arguments about whose number is right.

    How fast can dashboards refresh?

    Sub-second on streaming sources (Kafka + Snowflake/Databricks SQL Warehouses or Microsoft Fabric Real-Time Intelligence). Most enterprise executive dashboards we build refresh every 1–15 minutes, fast enough to act inside the same shift, not the same quarter.

    Can dashboards be embedded in our apps and portals?

    Yes. We embed Power BI, Tableau, Qlik, Sisense and Looker into customer portals, partner extranets, mobile apps and operational tools, white-labelled, with row-level security tied to your identity provider (Azure AD, Okta, Ping).

    What about adoption, won't business users still rely on Excel?

    Adoption is mostly a design and enablement problem, not a tech one. Our delivery includes a champions programme, hands-on training in Arabic and English, and usage analytics so we know which dashboards are actually used. Our typical clients hit 60%+ self-service adoption inside 6 months.
    See Your Data Come Alive: Executive Demo

    We'll connect to your data, build a live dashboard prototype, and show you insights you've never seen, in a 2-hour session.

    Call +966 54 597 3047

    🔒 No obligation · Free assessment · Results in 2 weeks